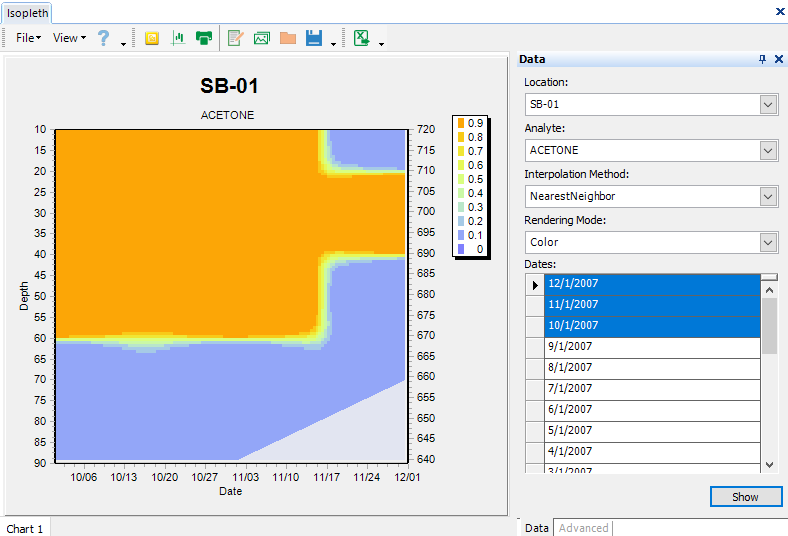
An Isopleth is a three-variable graph in which the horizontal axis shows time, the vertical axis shows depth/elevation, and the body of the graph shows the value of a given parameter. The following steps illustrate the process of generating an Isopleth. The Isopleth uses data from DT_BASIC_RESULT.
Click the Isopleth button ![]() , located in the Graphic Tools group on the Home tab, to open the Isopleth window.
, located in the Graphic Tools group on the Home tab, to open the Isopleth window.
See the Office Hour video on Visualization Tools in EQuIS Professional here.
Create an Isopleth
1.Select a Location.
2.Select an Analyte.
3.Select dates by clicking and dragging or by pressing and holding the Shift key, and clicking.
4.Click Show.
The Isopleth should now display.
Note: The Isopleth contour now allows you to export color, greyscale, and a classic contour. |
Enhance the Isopleth
Modifications can be made to the Isopleth graph in the same way as for the Vertical Profile.
Note: An Excel Isopleth export feature now exists that allows you to build a 3D view from result data. The Isopleth uses Nearest-Neighbor to interpolate missing values creating a contiguous 3D mesh from a non-contiguous XYZ input set. |
Troubleshooting
The Isopleth graph generates a blank output if the computer is using a date culture format in which the day element precedes the month element, e.g., dd/mm/yyyy. To resolve this issue, change the date format via one of the following settings:
1. Switch the Windows Display Language.
2. Change EQuIS Professional settings as documented on the Using EQuIS with Different Regional Settings or Languages page.
Accessing EQuIS Professional with the ANSI-standard date format of yyyy-mm-dd will allow the plotting of Isopleth graphs.